Power BI with multiple companies in NAV – repeatable approach
Last year we blogged about how to use Power Query to create reports across all companies. – see here. That approach is still valid with the new Power BI. However it has a few drawbacks that we would like to overcome with a new, better solution.
The main issue about it is that adapting it to another data source requires some rework. It is necessary to adapt the Power Querysource code to each query that should show data across companies. Additionally last year’s solution is missing a way to selectively include or exclude companies on a report per report base. We will address both issues in order to provide a more repeatable approach.
This general idea that we follow here is to use structures in NAV that enable us to make the configuration in our well-known environment NAV. Since different reports may need to be based on a different subset of companies, we introduced the new entity Reporting Code in NAV. We can assign one or more multiple companies to any Reporting Code:

In order to give Power BI the information about that reporting code – company – assignment, we need to create another simple page that just returns all rows across report codes:

Additionally we are creating a copy of page customer list and the query Sales Inv ENU:

We will publish these objects as web services in order to user them as OData-Feeds.
Data model in Power BI Designer
Today we are using Power BI Desktop (formerly Power BI Designer) to create the data model. The same steps would work in Excel 2013 with Power Query or in Excel 2016 (Data tab) as well.
The first Query that we are creating is a reference to the base path of our OData-Feed:

We are using this query to have a single place to change the connection.
A second simple query defines the type of the current report – it will act as the connection between the Reporting Code defined in NAV and different Power BI Reports. In this example we want to create a report of type “SALES”:

The interesting queries that do the magic are two functions RecordsPerCompany and RecordsForAllCompanies. The function RecordsPerCompany is defined as follows:
let
RecordsPerCompanyFct = (CompanyName,TableName) => let
Source = ODataBaseQuery,
SelectCompany = Source{[Name="Company",Signature="table"]}[Data],
FilteredRows = Table.SelectRows(SelectCompany, each ([Name] = CompanyName)),
UnpivotedOtherColumns = Table.UnpivotOtherColumns(FilteredRows, {"Name"}, "Attribute", "Value"),
TargetTable = UnpivotedOtherColumns{[Name=CompanyName,Attribute=TableName]}[Value],
TargetTableWithCompanyName = Table.AddColumn(TargetTable,"Company Name",each CompanyName) // Add "Company Name" column to resultin
TargetTableWithCompanyName
in
RecordsPerCompanyFct
CompanyName and TableName are the input parameter that this function expects. In the first line starting with “Source =” It will connect to the OData-feed by using the previously defined query ODataBaseQuery.
SelectCompany = Source{[Name=CompanyName]}, will return a list of all OData-endpoints according to my CompanyName-parameter, in my case for example for Company CRONUS AG:

Now that the company name input parameter was used successfully, we need to identify the table according to our second input parameter. In Power Query it is easier to deal with row-level data than with columns dynamically. That is why we are using the Unpivot-Function in the next step to obtain the following result (calling the function is simulated to show the changes step by step):

Based on this result we can retrieve the Value-Column of the appropriate line that is identified by the Name (Company) and the Attribute (Table-Name):

In the last step we are adding the company name as a new column:

Combining data of all companies
Now we need a way to combine the results of that previously defined function for multiple companies. This job is done by the function RecordsForAllCompanies that has the following definition:
let QueryForAllCompanies = (TableName) =>
let
Source = ODataBaseQuery,
Company_table = Source{[Name="Company",Signature="table"]}[Data],
Combined = Table.Combine(List.Transform(Table.Column(ReportingCompanies,"Company_Name"),each RecordsPerCompany(_,TableName))) // Call function RecordsPerCompany for each company and append (comnbine) the datain
Combined
in
QueryForAllCompanies
The gist is in this line:
Combined = Table.Combine(List.Transform(Table.Column(ReportingCompanies,"Company_Name"),each RecordsPerCompany(_,TableName)))
It is calling the RecordsPerCompany function for each row of a query called ReportingCompanies.
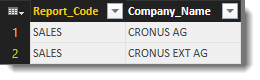
ReportingCompanies returns those companies that are assigned in NAV to each Report Code, in this example to Report Code SALES:
Instead of using this custom structure it would also be possible just to return all companies in this query or to make the selection in Power Query instead of NAV.
The result of each call is combined into a long table (similar to a UNION in SQL-terms) by levering the powerful List.Transform-function:
This function shows a nice aspect of Power Query functional language. We can use our own function (RecordsPerCompany) and apply it a list of records by using List.Transform.
Creating new tables with the help of RecordsForAllCompanies
In order to use this function we create a new query that calls the function RecordsForAllCompanies with the Table Name as the input parameter:
Data Model
If only transaction tables need to be based on all companies, the data modeling part would be exactly the same as on any single-company scenario. The table relations would have to be established and measures need to be defined. However this only works if all lookup-tables (master data) such as customer, item or G/L-Account would have already been synchronized across all companies in NAV – either by some sort of master data company process or just by defining the table as DataPerCompany=no. In other cases where both the transaction and the lookup-tables need to be sources by multiple companies, additional steps are necessary. We will go through the steps to handle cross-company lookup-tables in a subsequent blog-post.