Account schedule hierarchies in Power BI
Hierarchies are an important concept in most if not all BI-solutions. This is not different in Power BI. Hierarchies allow aggregating data on different levels - for example users may drill down into a date-hierarchy from the year-level to quarters, months and days.
Parent-child-hierarchies
This blog post is about a specific type of hierarchies: so-called parent-child hierarchies. In a parent-child-hierarchy a member of a certain table can be the parent of members of the same table. A classic example is an organigram where an employee can be the head of (parent) of another employee (child). Another example for parent-child-hierarchies are account schedules. Account schedules typically build up some sort of hierarchy.
Power BI supports a nice solution for parent-child-hierarchies that we will explain based on the example of account schedules.
NAV-account schedules
Our starting point is a Profit & Loss account schedule from NAV:

Account schedule in Power BI
With the help of Microsoft's Account Schedule KPI Web Services and some Power BI tricks it is possible to get the report in Power BI:

Analyze in Excel
By levering Analyze in Excel functionality the same account schedule can be seen in Excel - a tabular pivot table based on the same data model that is hosted on PowerBI.COM:

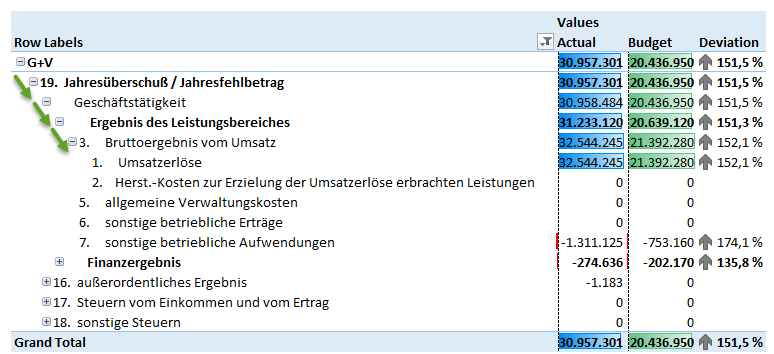
Expandable account schedule in Excel
What we finally want is to use the very same account schedule while being able to drill up and down on the different levels of our profit & loss hierarchy:
This comfortable way of expanding and collapsing different levels of a hierarchy is currently not fully supported by Excel what is why Excel may be the best frontend tool while relying on the data model and the real intelligence on PowerBI.COM.
Making of
When designing the solution, it was our intention to build up on a standard CRONUS (Extended) database without the need for any additional setup- and meta-data. It means that we need to infer the hierarchy entirely based on the definition of existing account schedules.
From our experience - and also confirmed by CRONUS demo-data, many account schedules show implicit hierarchies that can be systematically identified without any manual work.
The NAV-part
We followed the approach to use the totaling formula to try and identify the parent account schedule line of each line. In the example of the German P&L Account schedule, sales and cost of goods sold are summarized in a sub-total called Net profit from revenue.

Base on this formula it can be safely assumed that SUM01 is the parent row of both UK01 and UK02.
We created a new page object and added a calculated field that returns the parent line number:

We had to do some parsing of the totaling formulas in order to have a reliable algorithm.
The Power BI part
Now everything is prepared for Power BI.
Marco Rosso has a very nice explanation of parent child hierarchies in Power BI. We recommend reading it if you plan to implement something similar:
http://www.daxpatterns.com/parent-child-hierarchies/
In the query window we added a composite key of the account schedule name and the line no:
The same is necessary for the parent line no.

Now we can use the DAX-function Path. It traverses the hierarchy and provides the complete path to reach the current node - separated by |

With the help of this path, we can use another DAX-Function PATHITEM to retrieve the Key (Line No.) of a certain level.

Finally, since users of our report certainly do not want to work with line numbers, we need to look up the name of the account schedule name on each level:

Now everything is ready to combine these fields into our desired hierarchy. Six levels should work for most account schedules but more levels could be added as needed.

In order to make our calculations work in Power BI, we need to add some logic to our measures. First it is important that our measures do not aggregate values between different hierarchy levels since our Odata-feed already pre-aggregates the figures on each level. The second problem to solve is that account schedules in NAV are typically ragged hierarchies what means that the depth (number of levels) differs between nodes. Without any help from us, Power BI would fill up lower levels with the duplicate value from the previous higher level what would deteriorate usability.
The first issue is solved with the following measure:
Net Change Actual Raw = switch(min('Account_Schedule_Line'[HierarchyDepth]);
1; CALCULATE(Sum('KPI Lines'[Net_Change_Actual]);filter('Account_Schedule_Line';ISBLANK('Account_Schedule_Line'[Key Level 2])));
2; CALCULATE(Sum('KPI Lines'[Net_Change_Actual]);filter('Account_Schedule_Line';ISBLANK('Account_Schedule_Line'[Key Level 3])));
3; CALCULATE(Sum('KPI Lines'[Net_Change_Actual]);filter('Account_Schedule_Line';ISBLANK('Account_Schedule_Line'[Key Level 4])));
4; CALCULATE(Sum('KPI Lines'[Net_Change_Actual]);filter('Account_Schedule_Line';ISBLANK('Account_Schedule_Line'[Key Level 5])));
5; CALCULATE(Sum('KPI Lines'[Net_Change_Actual]);filter('Account_Schedule_Line';ISBLANK('Account_Schedule_Line'[Key Level 6])));
6; CALCULATE(Sum('KPI Lines'[Net_Change_Actual])))
HierarchyDepth is a calculate column that returns the length of the current path:
HierarchyDepth = PATHLENGTH('Account_Schedule_Line'[Pfad])
The solution for ragged hierarchies involves a couple of steps that are well described by Marco Rosso what is why we are not repeating them here.
If you are interested in the solution, please let us know.