Report on Inventory Performance with NAV
Today’s post is about a customer project that we worked on the other day. We were asked to provide a dynamic and flexible way to report on inventory and sales performance. We will explain the solution from top to down – starting with a screenshot of the final dashboard:

This dashboard gives a high-level overview of a number of measures - both related to sales and inventory. In this post, we would like to focus on inventory-related measures since NAV does not offer much flexibility regarding inventory reporting. We will create a measure that calculates the inventory value similar to the infamous Report 1001 Inventory Valuation in NAV; based on this measure and other intermediary measures we define the inventory turnover and inventory duration.
The dashboard shown in the last screenshot is sourced from a NAV 2009 database (with anonymized and “manipulated” data) using SQL Views. In this blog post however, we will use a NAV 2013 R2 Cronus Extended database and OData-Webservices as the data source.
NAV-Part - OData
First let’s take a look at the part in NAV. The main source of this report is the Value Entry table what is why we created a NAV-Query on that table:
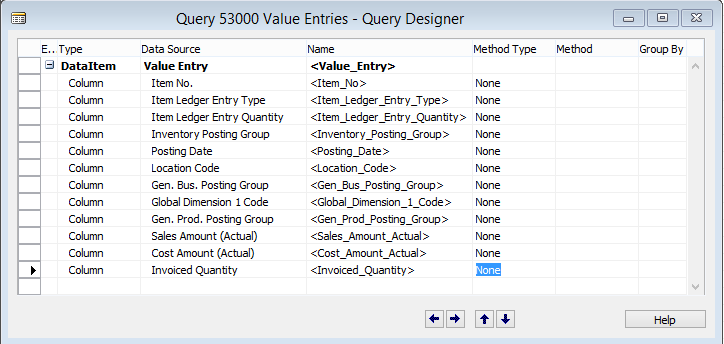
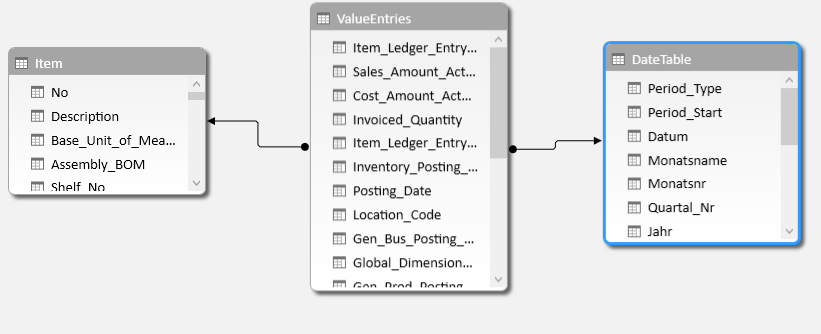
This query exports all value entries without any additional logic – with one exception: Cronus Extended had a few value entries that were not related to any item (probably just a minor problem in Microsoft’s test automation tools); we excluded those by using the DataItemTableFilter Item No.=FILTER(<>'') in order to avoid any differences between our total and the total of NAV’s inventory valuation report. Additionally we are using our own Data-Page (as explained here) with a relationship to the posting date column of the values entries and Page 30 Item Card as a lookup-Table for Items.
Tables and Measures in Power Pivot
This leads to the following diagram view:

Before jumping into the DAX-calculation that we created let’s take a look at the relationship of our measures that we want to report on – starting from the most complex one. It might be confusing first and make it slightly more time-consuming to re-build this model, in our experience this approach however makes much sense since it focuses on the final result – no unnecessary measure will be built; it is some sort of divide and conquer in DAX.
The most advanced inventory related measure is the inventory duration. The Inventory duration is supposed to show the number of days that a certain product (or products of a certain product category or vendor) stays on inventory until sold (or shipped to another location). Since it is easier to calculate the reverse (Inventory Turnover), inventory duration is defined as:[Inventory Duration] := DIVIDE (360; [Inventory Turnover] )
Inventory Turnover can be verbalized as the number of times that the inventory value is sold (or otherwise outgoing). Both could be calculated based on quantities or value; in order to allow that calculation on any aggregation-level (e.g. vendor) we focus on value-based calculations here. The DAX-equivalent to that description is the following:
[Inventory Turnover] :=
- DIVIDE (
[Cost Amount Outgoing Sum];
[Average Inventory Value]
)
[Cost Amount Outgoing Sum] is a sum of a calculated column called [Unit Cost Outgoing]:=SUM ( [Unit Cost Outgoing] )
[Unit Cost Outgoing] returns the Cost Amount Sum of all Value entries with a “Negative” sign:
[Unit Cost Outgoing] :=
IF (
ValueEntries[Sign] = "Negative";
[Cost Amount Sum];
BLANK ()
)
[Cost Amount Sum] is just the sum of the field Cost Amount Actual of the value entries:
[Cost Amount Sum] :=
SUM ( [Cost_Amount_Actual] )
The calculated column Sign is defined as:
Sign :=
SWITCH (
[Item_Ledger_Entry_Type];
"Sale"; "Negative";
"Positive Adjmt,"; "Postive";
"Output"; "Positive";
"Purchase"; "Positive";
"Negative Adjmt,";"Negative";
"Consumption"; "Negative")
In our real-life solution that is based on SQL-Views we added this column directly in SQL and also considered Application Entries on Transfers as the Inventory Valuation report did; this could be done by defining a Value Entries Page with a function to check the Application Entry of Transfer Entries instead of the Query. Currently queries in NAV unfortunately do not provide any way to add columns that require logic that is more complex than totals.
The average Inventory Value needs to do some time-related logic since we want to calculate a rolling 13 month average:
[Average Inventory Value] :=
CALCULATE (
AVERAGEX (
DISTINCT (
DateTable[Jahr_Monat] );
[Inventory Value]
);
FILTER (
ALL ( DateTable );
AND (
DateTable[Datum]
>= MIN ( DateTable[Datum] ) - 1;
DateTable[Datum] <= MAX ( DateTable[Datum] )
)
)
)
We originally defined the average inventory as a day-based average; however performance was quite slow with this measure; after changing the calculation to a rolling 13 month-average to avoid seasonality effects performance was good again.
The measure [Inventory Value] summarizes the cost amount of all Value Entries until the last date of the currently selected period. Due to the nature of the Value Entry table to store all in- and outgoing transactions, this total corresponds to the inventory value at a given point in time.
The if(min(Date…) part prevents that the inventory value is “extrapolated” into the future.
Final word
What we now have is an inventory valuation report that dynamically reacts to filters on vendors, products groups, products, dimensions, locations etc. Performance is still reasonable (less than 3 seconds for any action that we tested) with about 3 million value entries what shows DAX great power to calculate aggregates on the fly. Creating measures that build up on each other help to divide complex calculations into simplier sub-measures. Creating the layout of that dashboard in Excel is out of the scope of this blog entry, we just like to mention that we used Excel's CUBEVALUE-functions that provide all that flexibility that was needed. Using CUBEVALUES in combination with Power Pivot data and NAV deserves another - separate - blog entry.