Dynamic Security with NAV and Power BI

You may know that Power BI lacks some sophisticated security concept that SQL Server Analysis Services or even Dynamics NAV offer. One common approach to security in Power BI is to create separate files with different degrees of detail or pre-defined filters. This may became complex in maintenance if too granular rules are defined or if the rules tend to change regularly.
An interesting alternative for on premise Power BI is the usage of data driven security. Data driven security is often referenced as dynamic security meaning that the access rights can be defined dynamically on run-time without the need to recompile any source code or configuration files.
In this blog post we would like to go through a simple Power BI report that shows sales figures per customer. This analysis should be uses both by the sales representatives and the directors of Cronus. Sales reps however should only see sales of their customers whereas directors need the entire view.
It is our intention to reuse existing structures in NAV to accomplish this goal. Sales responsibility centers that may be assigned to users and customers serve a similar purpose what is why we use them here.The data model apart from the data security is very simple:

The fact table PostedInvoices is sourced by a Query on Sales Invoice Header and Sales Invoice Line, Customer is just a Page Query on the Customer table.
Username-Function
Power Pivot’s query language provides a function called USERNAME() that returns the domain name and username from the credentials given to the system at connection time. Unfortunately at the time of this writing the USERNAME-function is not supported on Powerbi.com – at least the return value does not help to identify the windows user that is currently logged in. It will however work on the Power BI Designer and in on-premise Excel.
Data Transformation in NAV
Knowing the username and the responsibility center per customer and transaction – the next thing Power BI needs to be aware of are the responsibility centers that are allowed for each user based on the user setup. Instead of using standard NAV’s field Sales Resp. Ctr. Filter, we created a new field since the existing field only allows 10 characters thus limiting the filter to only one single responsibility center. Users such as the CEO should be able to see all responsibility centers what is why filter expressions like HAMBURG|DÜSSELDORF or * need to be available:

Sending this filter string in its raw form to Power BI would make it difficult to evaluate all sort of filter expressions in Power Query or Power Pivot. Instead it makes a lot of sense to create a Page Web Service in NAV that evaluates the filter expression and returns one row per User ID and Responsibility Filter Combination:
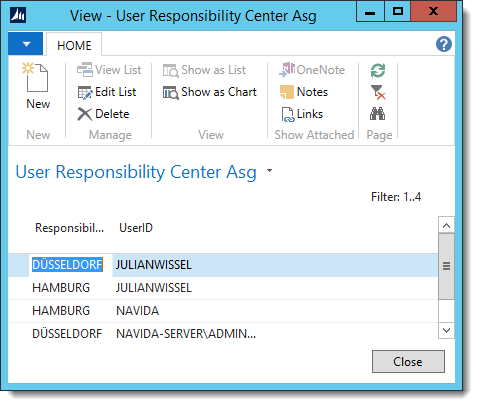
Cronus Germany has only two responsibility centers what is why the asterisk is translated (expanded) to two rows DÜSSELDORF and HAMBURG.
Cross-filtering
You may be aware of one of the main principles behind the engine of Power BI: cross-filtering. It means that a filter on the one-side (lookup) of any table relation will flow to the many side. In our example above it explains why setting a filter on any customer name (or selecting customer city on the row axis of your pivot-table) will automatically lead to measures showing only the total line amount according to that filter or selection. Power Pivot has a rather that allows filters to flow into the opposite direction – from the many to the one-side. This feature is actually much easier accessible in the Power BI Designer and Excel 2016 but we will use the older approach due to downward-compatibility.
We could rephrase our problem in the following way: Show only those posted documents that have a responsibility center that is allowed according to the user setup. If we add this user setup table – responsibility center table and a lookup-table that just returns one row per responsibility center we get the following (part of the) data model.

Let’s first create a relationship between the PostedInvoices table and our new lookup-table:

This ResponsbilityCenter-Table will act as a bridge table between our access rights and posted documents. The last table relationship that we need to define is the following:

The entire data model will look like this:

Measures with and without security
The first measure that we create is the following:
[Sales Amount No Security] := SUM ( PostedInvoices[Line Amount] )
It will just sum up the line amount of all posted invoices. In order to test the result, I changed my user to be limited to responsibility center HAMBURG. The pivot table however gives me too much information.
The problem here is that the DAX-engine only implicitly populates the normal filter direction from the one to the many direction. In order to enforce the opposite direction, we need to add those tables to the calculate-function that should act as filter on our fact table – in our case tables ResponsibilityCenter and UserSetupRespCenter since both should be part of the filter-flow.

Furthermore DAX needs to know how the USERNAME-function and the rows in the UserSetupRespCenter-Table relate to each other. If Windows Authentication is used in NAV, the field User ID should correspond to the return value of the USERNAME-Function, what translated to this filter condition:
UserSetupRespCenter[UserID]=USERNAME();
If other credential types are used, a separate mapping to the windows logins will be necessary. Putting both together, we get this still rather simple DAX-formula:
Sales :=
CALCULATE (
[Sales Amount No Security];
UserSetupRespCenter[UserID] = USERNAME ();
ResponsibilityCenter;
UserSetupRespCenter)
The Result
We can put this new measure into our pivot table next to the first measure:

This looks much butter since I only get sales values for HAMBURG, we just would want to remove the measures Sales Amount No Security from the data model to avoid any security vulnerability. We may add another field such as the customer name to the row area of our pivot table to make sure that our filter is also working on different level:
It does work correctly because only the listed customers have sales in responsibility center HAMBURG. We added another measure
Share of Total Sales := Divide([Sales];calculate([Sales];ALL(Customer)))
that shows the sales as the percentage of all sales. Please note that derived measures such as this one consider our dynamic security without any extra effort.
CurrentUser :=
RIGHT (
USERNAME ();
LEN (USERNAME ()) - FIND ("\"; USERNAME ())
)
Finally we added this measures as a cube-value function next to the pivot table.
This data driven approach may be easily adapted to any other data structure – other common examples are reports on General Ledger Entries that should be filtered according to cost center responsibilities. It could even be possible to bind access rights to the standard security roles of NAV – e.g. all G/L-related measures could only return values if the logged-in user has read-access to Table G/L-Entry in NAV.